One of the best features of Power BI is the ability to get up-to-the-minute data on a customized dashboard. Not all metrics require this level of timeliness, but a few types of data do, such as temperature data from food transportation containers or telemetry from production machinery. Standard Power BI reports do not support this type of minute-by-minute reporting, so you need to set up a streaming dataset when time is of the essence.
What is a Power BI Real-Time Streaming Dataset
In Power BI, a streaming dataset is a particular type of data that arrives via an API push. It can display data immediately upon receiving it and doesn’t store that data long-term, only keeping it for roughly 1 hour if you enable historic comparison. Streaming datasets are about answering the question: “What’s happening right now.”
This blog will show you a simple way to get started using a streaming dataset using Power Automate and some player count data from Steam (a PC gaming platform).

Creating a Streaming Dataset
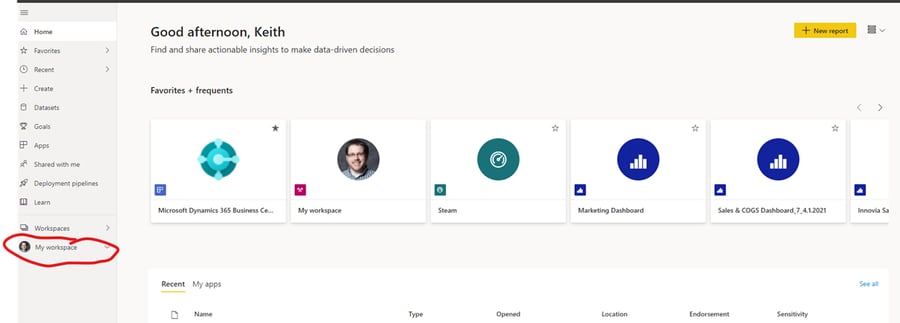
To get started, head over to the Power BI portal (https://www.powerbi.com) and log in. You can do this in any workspace, but the “My Workspace” workspace is an excellent place to start for demonstration purposes. Click it to go into your My Workspace.
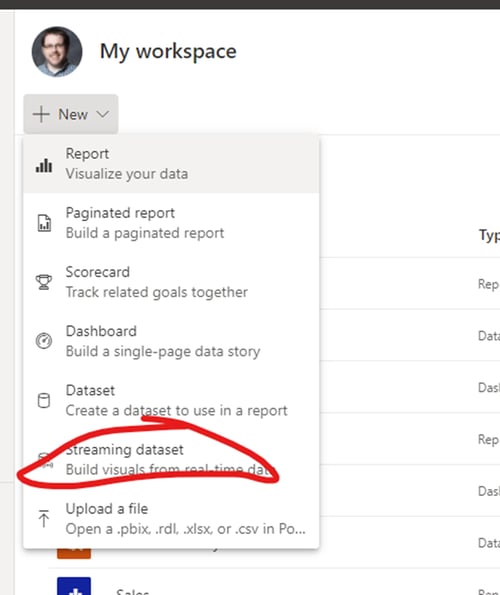
Click +New in the upper left corner and then select Streaming Dataset.
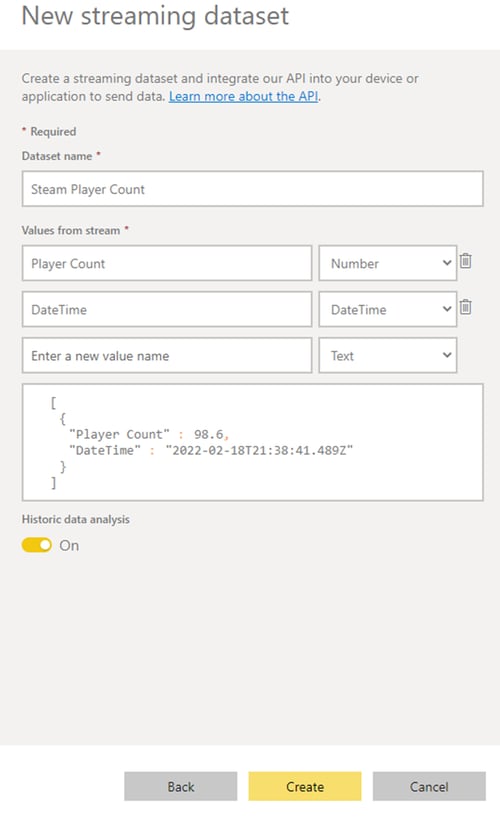
The default option should be API, so select Next. Now you need to define what data is in your streaming dataset. You need a player count number field and a DateTime field (I call it DateTime) for the current time. You also want to turn on Historic data analysis, so it looks like the below screenshot. Then hit Create.
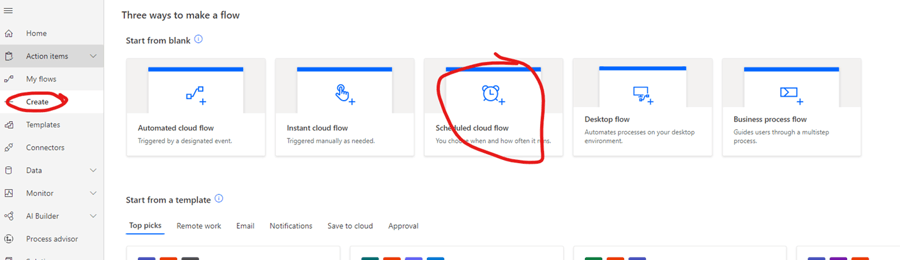
 Now that that’s done let’s head to https://flow.microsoft.com to build our Power Automate flow that will populate our real-time streaming dataset. Once logged in, select + Create from the left menu and then choose “Scheduled cloud flow.”
Name the flow anything you like and set it to repeat every 1 minute (which should be the default). Click Create to go into the editor. This is where it gets a little tricky but stick with me. Add a new step and search for HTTP. Add that step.
Now you will need to enter the following into the URI field (ignore all the other fields): https://api.steampowered.com/ISteamUserStats/GetNumberOfCurrentPlayers/v1/?appid=413150
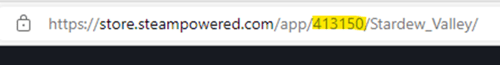
What is that, you ask? This is an API call to a public API with Steam, a PC gaming service. It returns the number of current players using a particular app. In this case, I’m using appid 413150, which happens to be the game Stardew Valley. However, you can replace this with any game you want to track. Search for the steam page for that game, and in the URL, you will find the appid.
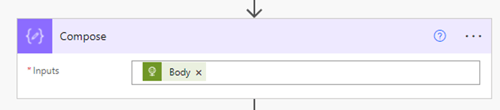
Now, we need to clean up our API call, so add a step to the flow called Compose and insert in the Inputs field the Body from the HTTP step.
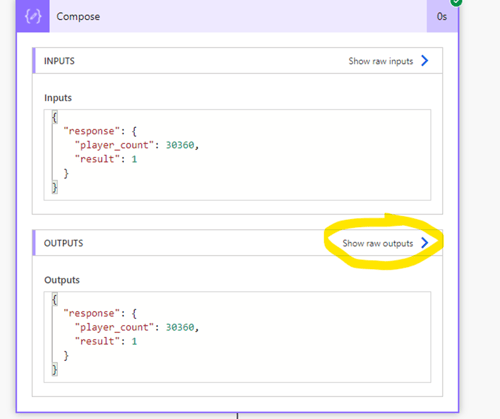
Now run your flow by clicking Test in the upper right corner. It should succeed, and if you expand the compose step, you will see both inputs and outputs. Click Show raw outputs.
Then copy and paste everything that appears. Now close the side window and click Edit again. After your compose step, add a step called Parse JSON. Set the Content field to the Body from your HTTP step, then click Generate from sample.
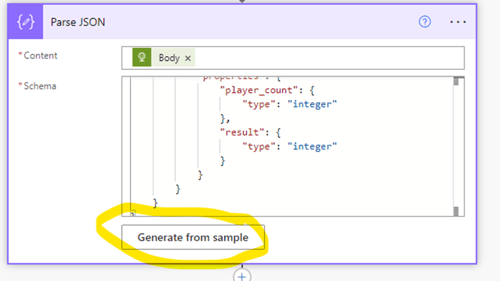
In the dialog box that appears, paste the information you got from the previous run. Confirm, and your Parse JSON step will now have a schema.
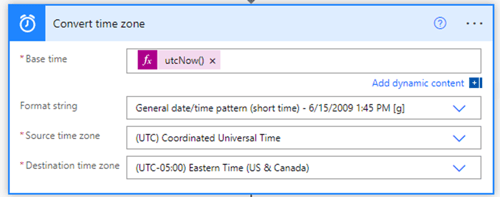
An optional step is to convert the current time from UTC to your current time zone. To do so, add a Convert Time Zone step after your Parse JSON step. In the base time field, enter the expression utcnow(). Then select Coordinated Universal Time as the source time zone and your local time zone as the destination.
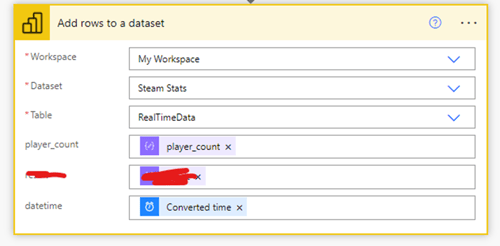
Now for the final step. Add a new step called Add rows to a dataset that uses the Power BI connector. Find the streaming dataset you made by selecting My Workspace and the dataset name. The table should be RealTimeData. You will be prompted to enter what you want to put in each field. You should see a dynamic content field for player_count from your Parse JSON step that you can put into player_count, and then use the converted time or utc() as the datetime.
Now start your flow!
Putting It All Together in a Power BI Dashboard
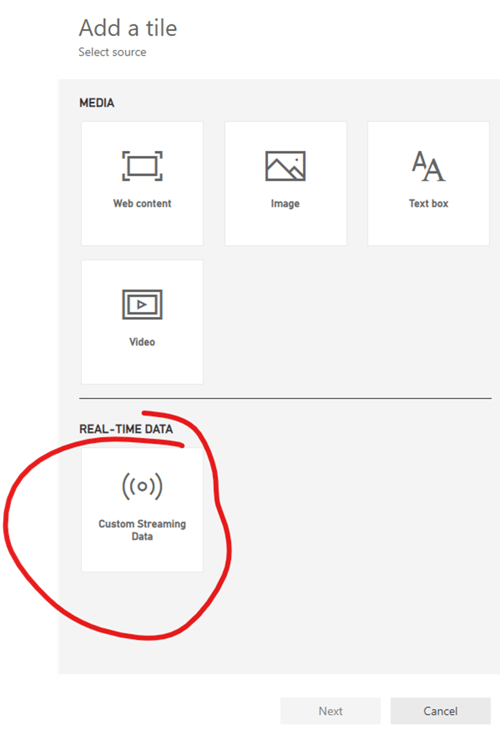
Go back to the Power BI portal, and in your My Workspace, add a dashboard. Under edit, click add a tile and select Custom Streaming Data in the dashboard.
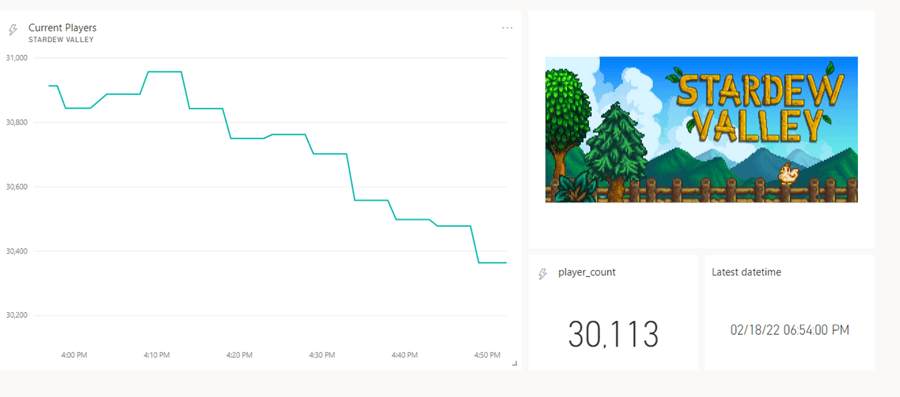
Now you can access your streaming dataset. I recommend adding a line chart with the datetime field on the axis and the player_count as a value. You can add more tiles if you wish to make something that looks nice. Here’s what I put together.
Let us know what you’ve been able to do with real-time streaming datasets in Power BI. Any other fun APIs you can access for these types of use cases? Let us know.