Are you building a Power BI model with multiple data sources? Do you want to ensure you have the smoothest experience possible and avoid wonky visualizations? It all comes down to ensuring your data model is sound. But how do you start that process?
In this blog, I will share a few quick tips to help you prepare to build relationships between your tables to maximize your success. This is not intended to be a full tutorial (for that, register for our next Introduction to Power BI class) but a fast rundown of some things that will help you greatly but aren't immediately obvious when you start building data models.
Tip #1: Ensure Your Data Has Keys
An essential step to building a data model from multiple sources is ensuring that there is a key column between them. Without this, Power BI won't be able to interpret how your data fits together.
A simple example would be if you have a sales order table that adds revenue to specific General Ledger accounts. That table would need to have a key if you were to relate it to a Chart of Accounts from your system. Fortunately, this is almost always the case, as the key you can use is simply the G/L Account Number. As long as that's on the table, you will be able to build the relationship.
You can also use things like a sequentially generated ID or serial number to relate tables based on what kind of data they contain.
Tip #2: Use a Star Schema
This tip delves into what should actually be in each of your tables. Microsoft and many data professionals recommend using a "Star" schema for how you arrange the relationships in your tables. When using this approach, you have two types of tables:
- Fact Tables -- These tables show discrete events you would like to measure. Think transactions, jobs, or website visits. Usually, there is a date for when the event occurred and several pieces of categorical data. It almost always includes at least one measurable value, often a dollar amount or count.
- Dimension Tables -- Think of dimension tables as lists of categories and values that affect them. For example, if your fact table lists transactions, one dimension table may be a list of customers. Each line on that table will begin with the customer's ID number, and then pertinent information for the customer will follow: address, phone number, Customer Engagement Specialist name, etc.
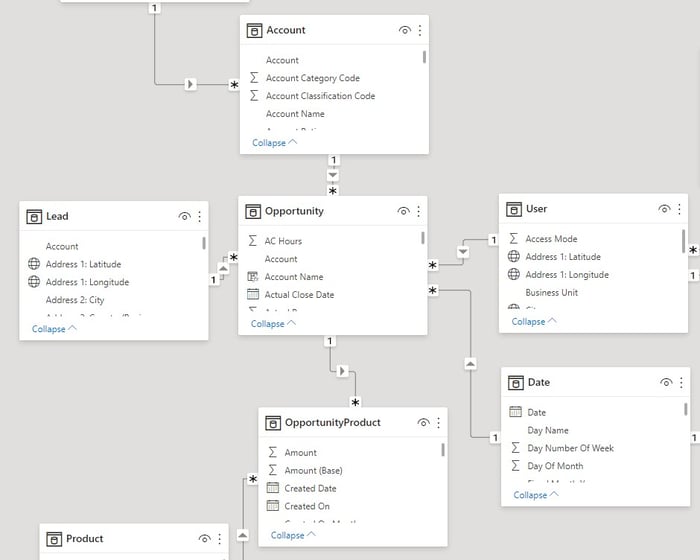
As you can see, the Star Schema gets its name because with your fact table in the middle, you can arrange all your dimension tables around it like the points of a star.
Using a Star Schema helps you minimize many-to-many relationships in your data model, which can create much confusion and often isn't necessary. It's better to rely on the types of many-to-one relationships built by the Star Schema.
Tip #3: Create a Date Table
Especially if you have multiple fact tables in your model, it's critical that you create a separate date table. Doing so allows you to match things that happened on one table with things that occurred on another by date. For example, a transaction may occur on 1/1/2021, but also a job was completed on that same date. You want your model to understand that.
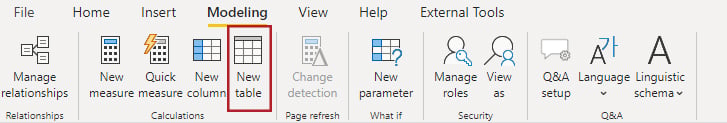
Luckily, it's straightforward to create a Date Table. In most cases, you can follow this simple process:
- Click New Table in the Data Modeling section of the ribbon.
- In the formula bar, type "Date = CALENDARAUTO()"
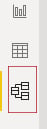
- Click into the Model tab on the left side.
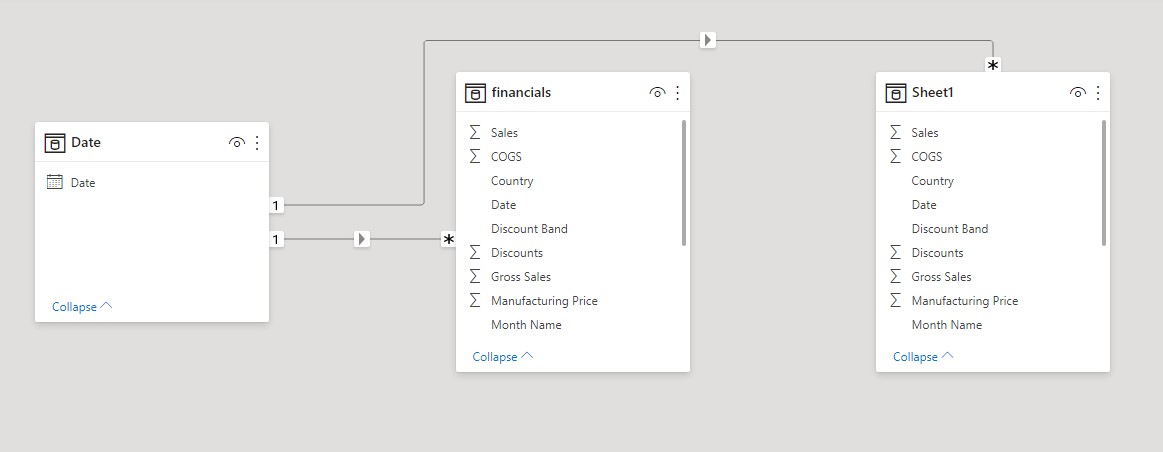
- Drag the date column from each of your Fact Tables to the Date column in your Date Table.
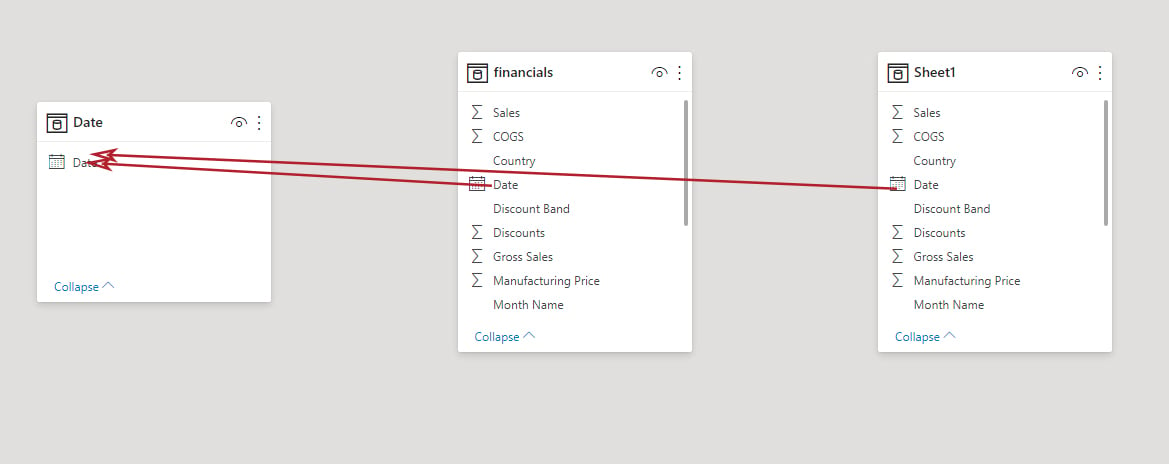
- If you've succeeded, you will see that the relationships created are one-to-many, with the "one" being your Date table and the many being the fact tables.
Tip #4: Hide Your Keys!
Just like you wouldn't leave your car keys in the car when you park it, you don't want to keep the key columns visible for your users. After all, they would never want to visualize Account #144433; they would want to see the company's actual name.
Likewise, if you have built a date table as we suggest above, it's possible that your users could grab the wrong date field when they are using a filter, and then only half the data is affected by the filter. You want them to use your master date column for filters.
It's effortless to hide columns (or entire tables) from users in Power BI. Just right-click it and select Hide in report view.
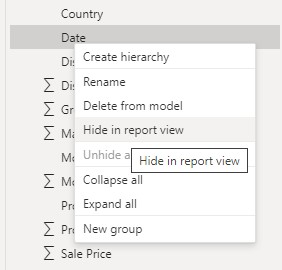
You will still see it in the report builder, but your viewers will not. Rest assured, any relationships that use those columns will still work.
Tip #5: Try It
I hope these tips will be useful to you as you start building relationships between your data sources in Power BI. As I conclude, I will add that the best way to learn this is to try it. As you do so, you'll likely learn more about your own data and find even more useful strategies to create the KPIs that matter to your business.
Want to learn even more about Power BI and how we can help you get going with it?