The Power BI template for Dynamics 365 Sales from Microsoft is a great resource, but if you have changed the field options for default fields, it may be missing this data. In this blog, I'll show you how to fix that problem using the commonly tweaked field "Industry."
As I mentioned at the end of the last blog, now that you have the report in the Desktop version of Power BI, you can edit the report, its pages, all the visualizations, and even the data itself as much as you wish. The sky’s the limits, and it pays to approach this project collaboratively if multiple departments might be using your report.
To follow along with this process, you will need to complete the initial steps I outlined in my previous blog. Once that's complete, come back here. I'll be using the field "Industry" for this example, but this process works with several other default fields if you have added custom options to them in CRM.
Adding Custom Options to the Industry Field
If you have customized your industry options for accounts, you may notice right away that many of your opportunities show the industry as “(Blank)” in your Power BI visualizations, even though you have them set correctly in CRM. This discrepancy occurs because the template is only configured to handle the “out-of-the-box” industry lists Microsoft provides in Dynamics 365 Sales. To get your customized industry options to appear, you need to tweak one of the tables. Here’s how:
- Click Transform Data (or Edit Queries) in the ribbon once you have opened the report in Power BI Desktop.
- In the left menu, look for IndustryCodeOptions under the Make Tables folder. Click into it.
- You will now see a simple table with the industry code (which is the internal code for each field option in Dynamics 365 Sales) in one column labeled "Value" and another column labeled "Option" that contains the corresponding industry name.
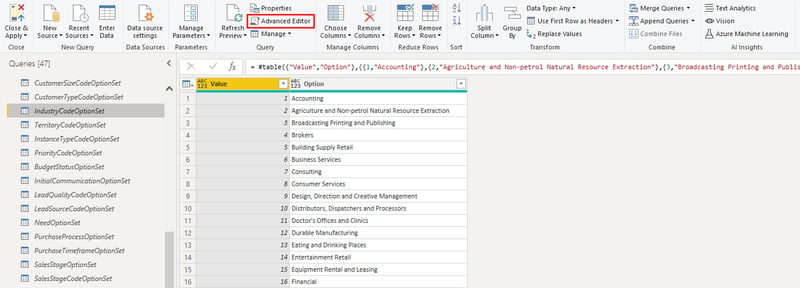
- To edit this list, click Advanced Editor on the ribbon. I recommend enabling Word Wrap under the Display Options for this. You will see coding that looks like this:
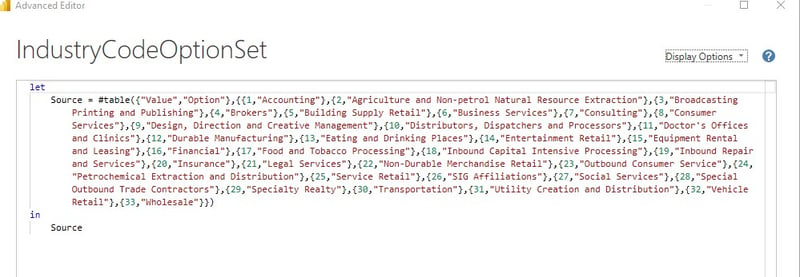
- Don't panic! This is all much simpler than it looks. It’s a listing of internal field option codes matched with industry names arranged like this: {“CODE”,”INDUSTRY NAME”}. Each set is separated by a comma.
- To add a new option, simply add a comma after the last set and create a new pairing. For example, if your code is "350" and the industry name is "Bicycle Repair," add the entry {"350","Bicycle Repair"}. It’s helpful to pull up your industry field option list from Dynamics 365 Sales for reference. If you don't have access to this, your CRM administrator should be able to assist you.
- Once you’ve added all your custom industry options, click Done.
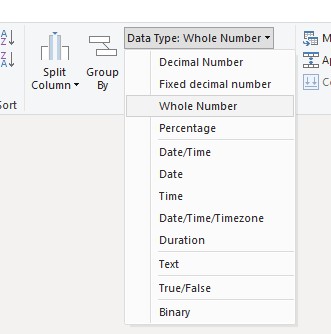
- If any of your values are very high numbers, you may see them left-justified in your table. They can't be read properly when they are. Highlight the left column labeled “Value” and select the Data Type dropdown in the ribbon. Select Whole Number, and the numbers should be properly right-justified.
Now when you Close & Apply, your new industries will appear in your visualizations once the updates have processed.
Why this Works and Other Fields to Try
If you're wondering how editing this separate table changes the industry options available for your Account entity (a completely separate table in Power BI), here's why it works. By default, CRM sends code values for the industry field to Power BI, not the display names. This means if you made any kind of visualization with the raw data, it would refer to industries by these numbers instead of their actual names, which would be quite confusing to the report reader.
The Microsoft template solves this for you. It includes a data transformation step that joins the Account table with the IndustryCodeOptions table we edited above. This process is very similar to Excel's VLOOKUP function, as it will read the code from the Account table, find the row with a matching code in the IndustryCodeOptions table, and then create a new column with the corresponding industry name for each row in the Account table. If it doesn't find a match, that column returns no data, so the visualizations will show the accounts as having "(Blank)" industry. By adding your custom options into the IndustryCodeOptions table, you make sure they are found when the tables are joined.
This same concept works if you have custom values in many other fields, such as:
- Sales stage
- Territory
- Customer type
- Lead source
- Account rating
- Activity status
- And more!
To find all these options, browse the tables with "OptionSet" in their names under the Make Tables folder in your Power Query Editor.
I hope this brief tutorial has been helpful to you as you model your custom values in Power BI. In the next blog, I'll show you how you can add completely custom fields to your data so you can visualize the data that matters most to your business. See you then!