If you’re like many business leaders, when you face a problem, your first instinct might be to fix it as soon as possible. This eagerness can be an asset, but when your problem is one of process, it pays to approach your solution more carefully; otherwise, you risk running into the same problems again and again.
At Innovia Consulting, we use Value Stream Mapping to help our clients address process problems. It’s an effective way to understand a process, identify its issues, and then make an action plan to improve.
The first step is to map your existing process. This step is especially helpful if some of your processes are not well-documented or defined. Let’s take a look at a few ways to do this.
Mapping Styles
Baseline: Flow Chart Style Map
When thinking about Value Stream Mapping, it’s helpful to start from a point of familiarity. Nearly everyone in the business world knows and likely has used flow charts to illustrate a process. A typical flow chart consists of the following items:
- Starting point
- Ending point
- Task/Activity boxes
- Decision diamonds
- Alternative branches
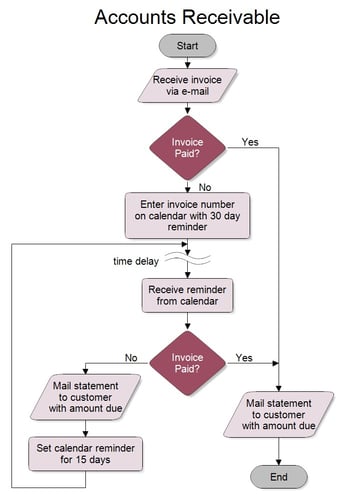
Figure 1: Example of a typical flow chart
This type of mapping is great for mapping out logic flow, but it does not work as well when defining a cross-functional business process. When working through this type of process, I recommend using one of two Swim Lane Map options below.
Swim Lane Map 1
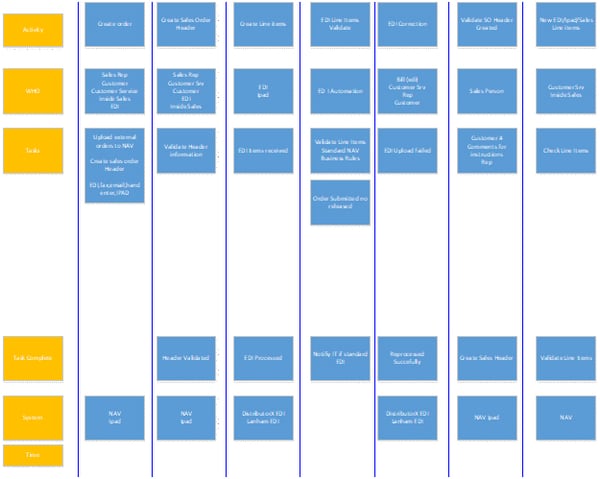
Figure 2: Example of Swim Lane Map 1 (click image to view larger version)
This version of the Swim Lane Map has a high level of detail for each activity. Using it helps you gain a deeper understanding of individual activities in a process. It includes the following elements:
- Activity: What happens in this step
- Who: What departments or personnel are involved in the activity
- Tasks: What is being completed during the activity
- Task Completed: What happens when the activity is completed
- System: What computer or manual systems are used
- Time: How long it takes on average to complete the activity
Swim Lane Map 2
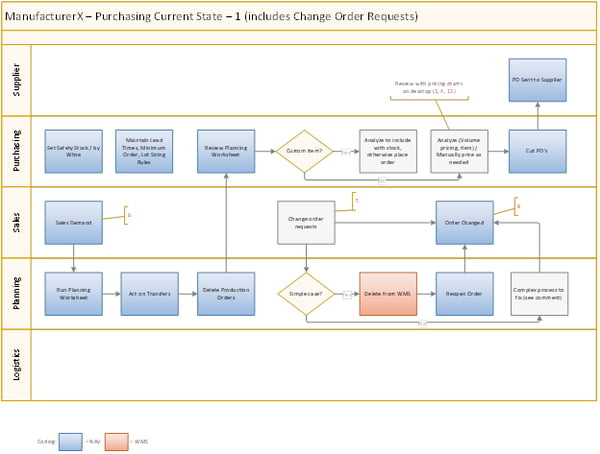
Figure 3: Example of Swim Lane Map 2 (click image to view larger version)
This alternative Swim Lane Map option is visualized horizontally and includes Flow Chart Symbols to represent its logic. This type of mapping shows you:
- Tasks mapped as actions that are completed in the process
- “Functional Bands” (swim lanes) to show who/where a task is performed
- External functional bands (customer, supplier) for tasks
- Time for each task/time frames for groups of tasks (optional)
- Coding for the system involved/comments for task detail
Compared to the previous option, this Swim Lane Map is better for capturing the overall process logic flow and functional handoffs.
Regardless of which type of mapping you use, your goals are the same:
- Diagram how value is currently delivered. This is known as your Current State and helps you identify where waste occurs.
- Identify areas of improvement leading to a diagram of how value should be delivered. This is known as your Future State.
Querying the Process
Once you have outlined your Current State map, how do you evaluate what should be different for your Future State map?
The most straightforward way to discover areas for improvement is to run through a series of questions about your process:
- Should an operation or step be done at all? Could it be eliminated? Can we reduce it?
- Which activities add value, and which do not?
- Are there any issues or possible action items we can move on now or soon?
- Which tasks enable a competitive advantage?
- For each step, ask yourself, “If the customer knew we were doing this, would they ask us to stop to lower the price or deliver faster?”
- Are there ways to make the activity more efficient and accurate?
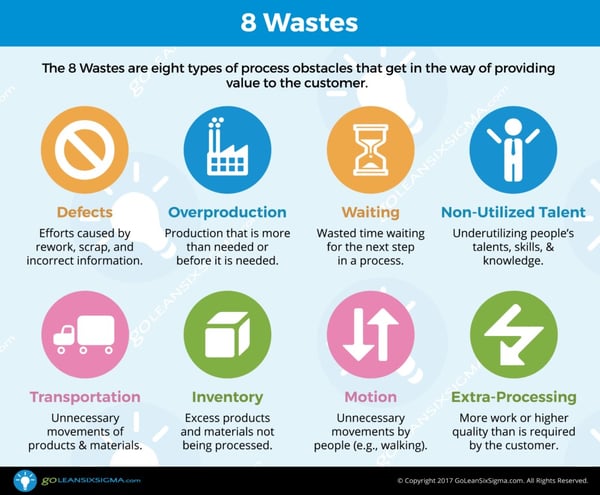
A handy tool, when querying the process, is to also ask if there are areas where the Eight Wastes of Lean apply. At first these may seem oriented to manufacturing, but in reality, they apply to any process:
Once you’ve delved into these questions, you are bound to find ideas for process optimizations and, likely, even more questions to help you build an improved Future State map.
The Process for the Process
Now that I’ve discussed the components of the process, let’s outline a general procedure that you can follow to conduct your Value Stream Mapping sessions.
Initial map and discovery
The first step is to map your current process. We recommend you scope this project so it can be completed in one-day and include a cross-functional team of knowledgeable doers (usually middle managers).
Identify issues and metrics
Once you have your Current State map, start asking questions of the process. Determine what’s important, what’s not, what can be eliminated, and what can be changed. Classify your activities by whether they add value or not.
Findings
Once you’ve done all that, you’re ready to examine the findings. This step is where you determine what you will do to change your process. At Innovia, we divide action items into three types:
- Do-its: Steps that can be taken immediately to affect change.
- Events: Actions that may take some analysis and cost but are not resource-intensive. Typically, they have a localized effect.
- Projects: Actions that require teamwork across functions, more in-depth analysis, and costs that require a cost-benefit analysis.
These action items are intended to shift your process into the Future State Map, which you produce in another session with your team after you share your findings.
Conclusion and Some Recommendations
I hope this brief outline of the Value Stream Mapping process has been helpful to you. I have found it to be an effective way for businesses to streamline processes so they can create more value for their customers.
Before I close, I want to share some recommendations for how to conduct meetings with your Value Stream Mapping team.
- Set some meeting rules.
- Everyone is equal
- Focus on the process, not the person
- One conversation at a time
- Keep it low-tech with a flip chart, sticky notes, and markers.
- Use a room with a lot of wall space.
- Keep phones off and laptops closed during your workshop.
Every company is different, but we have found that these guidelines ensure your workshop is as effective as it can be. I hope this exploration of the Value Stream Mapping process is useful to you and your organization.


While this article is original Innovia content, it first appeared online at: https://blog.dynamiccommunities.com/magazine/what-if-your-process-is-the-problem.