If you’re using Dynamics 365 Sales (sometimes called Dynamics CRM), you know the power of real-time, accurate data. Your customer accounts, contacts, opportunities, and much more are meticulously tracked to keep your sales, marketing, delivery, customer service, and management teams on the same page. But when it comes time to report, how are you presenting the data?
If you’ve always wanted to transform your CRM data into insightful visualizations, you need to try Power BI. With this tool (part of the Microsoft Power Platform), you can take your CRM data and start to make sense of it. You can begin drilling into metrics you’re curious about and discover new avenues for growth.
Best of all, it’s easy to get started with Power BI for Dynamics 365 Sales. Microsoft provides an easy-to-use template that, in many cases, works right out of the box; however, in my experience, there are a few tweaks that many businesses should consider to make the data a little cleaner and more actionable.
In this first part of my short blog series, I'll share how you can set up the template in both Power BI Online and Power BI Desktop. I'll explore a few tweaks you can make to really tap into this template's power in upcoming posts.
Setting Up the Microsoft Template in Power BI Online
Let’s start with finding the Microsoft template. If you would like to see how it operates without customization, I recommend starting with the Power BI online platform and pulling the template in. Here’s how to do it:
- Log in to Power BI Online. You can start at https://powerbi.microsoft.com and log in with the Microsoft account associated with your subscription (usually your work account).
- Click Apps in the left menu.
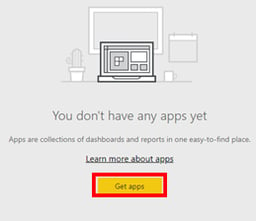
- If you have never added apps before, your screen should look like the left screenshot below. Click Get Apps to add one.
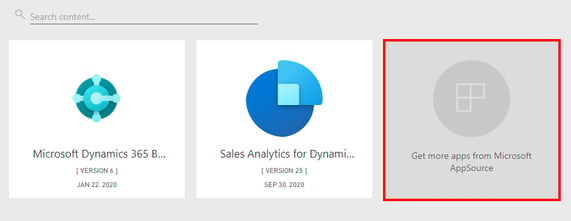
- If you have apps already, your screen will look like the right screenshot below. Click Get more apps from Microsoft AppSource.
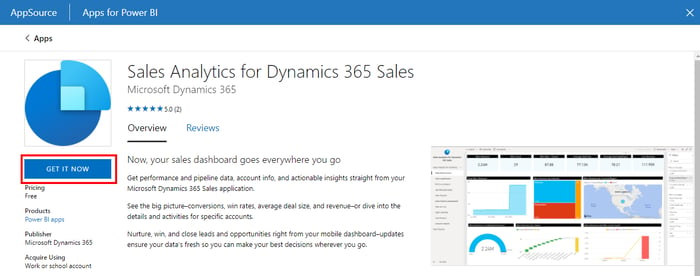
- Search for Sales Analytics for Dynamics 365 Sales. Click into the app and then click Get It Now on the AppSource listing.
- You will be asked to create a workspace for your app. Rename it if you wish, then confirm.
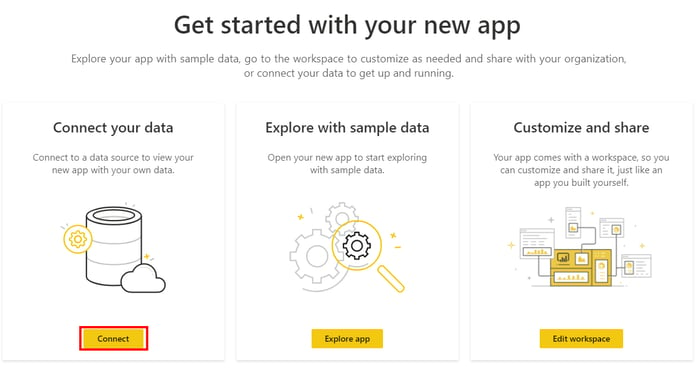
- Once you install the template to a workspace, click on it. You will then be connect to your data to allow the template to work. You can certainly use sample data if you like, but I recommend connecting your Dynamics 365 Sales data by clicking Connect.
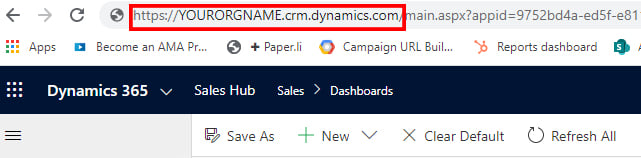
- You will be asked to provide your D365_Sales_URL, which you can find as the root for any page in your CRM (as shown below).
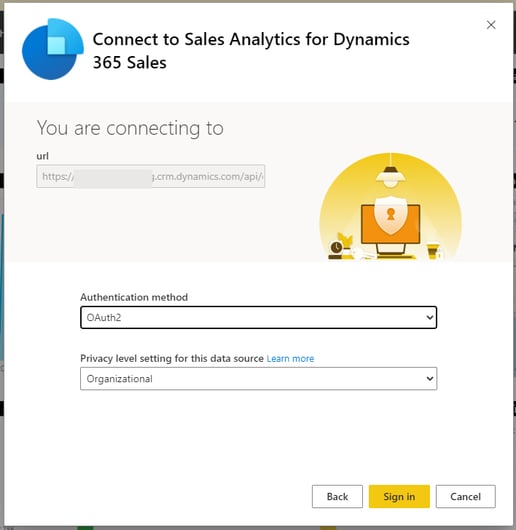
- Once you input this URL, you will log in with your credentials. Before it takes you to the login screen, it will ask you how you would like to authenticate. In this case, you want to use the OAuth2 Authentication Method and the Organization Privacy Level setting, as shown below. Once you click Sign In, you will need to log in to your Microsoft account as usual.
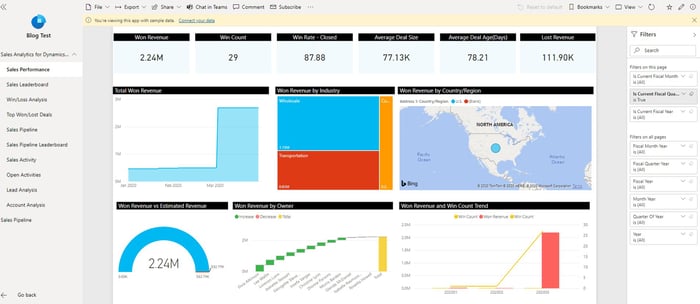
- Once you log in, you’ll be able to browse the pre-built report with several key pages filled with useful information. It may take a few minutes to refresh the data for the first time. When it's ready, spend some time getting to know what is displayed. Clicking into each page in the report and look at the visuals. If you’re like me, this will give you some ideas right away on how tweak them.
At this point, if you have minimal customization to your Dynamics 365 Sales system, you may be good to go. The Microsoft reports are helpful and cover a range of metrics that many organizations care about. Still, if you see holes in the data, unnecessary charts, or missing KPIs that you want to see, you will need to configure the report in Power BI desktop.
Working with the Dynamics 365 Sales Template in Power BI Desktop
To make any substantial changes to this template, you will need to use the Power BI desktop application. Here’s how to get the template downloaded and configured so you can get to work:
- Go to https://docs.microsoft.com/en-us/dynamics365/sales-enterprise/customize-template-apps. Under the Prerequisites section, you’ll find a link to download the Power BI report for Sales Analytics for Dynamics 365 Sales
- Once the file is downloaded, open it using the Power BI desktop app.
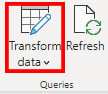
- As mentioned on the Docs site above, to connect your data, you’ll need to select the Transform Data (or Edit Queries if you are in an older version) option in the ribbon.
- In the window that appears, under Other Queries, select the parameter D365_Sales_URLquery (1).
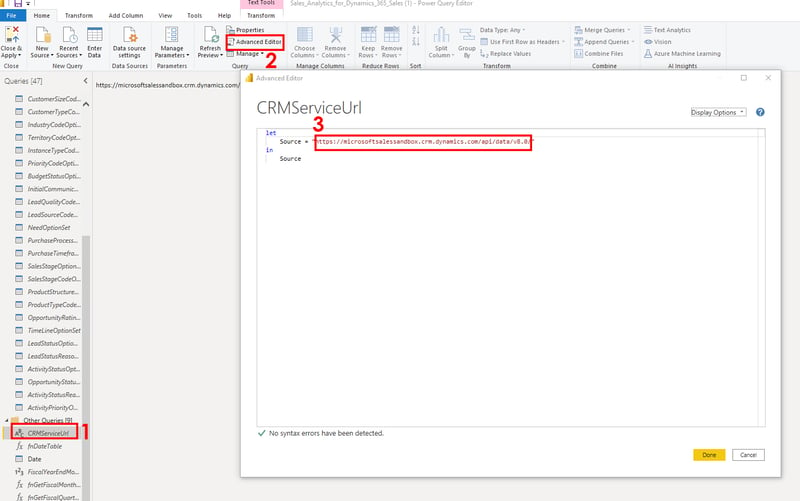
- Select Advanced Editor (2) from the ribbon and insert your Dynamics 365 Sales instance’s URL just like above into Source = line (3).
- After clicking Done, select Close & Apply from the ribbon. It may take some time to load your data, but it will load your data, and it should look exactly like the Power BI online version.
Now you are ready to work with your data! The Power BI Desktop application has more flexibility with how your data is presented and gives you clearer insights into how the template uses your CRM data. Spend some time examining all the tables and entities Microsoft provides, and in my next blog, I'll share some tweaks you might consider making to help your business make the most out of it.